What it is for
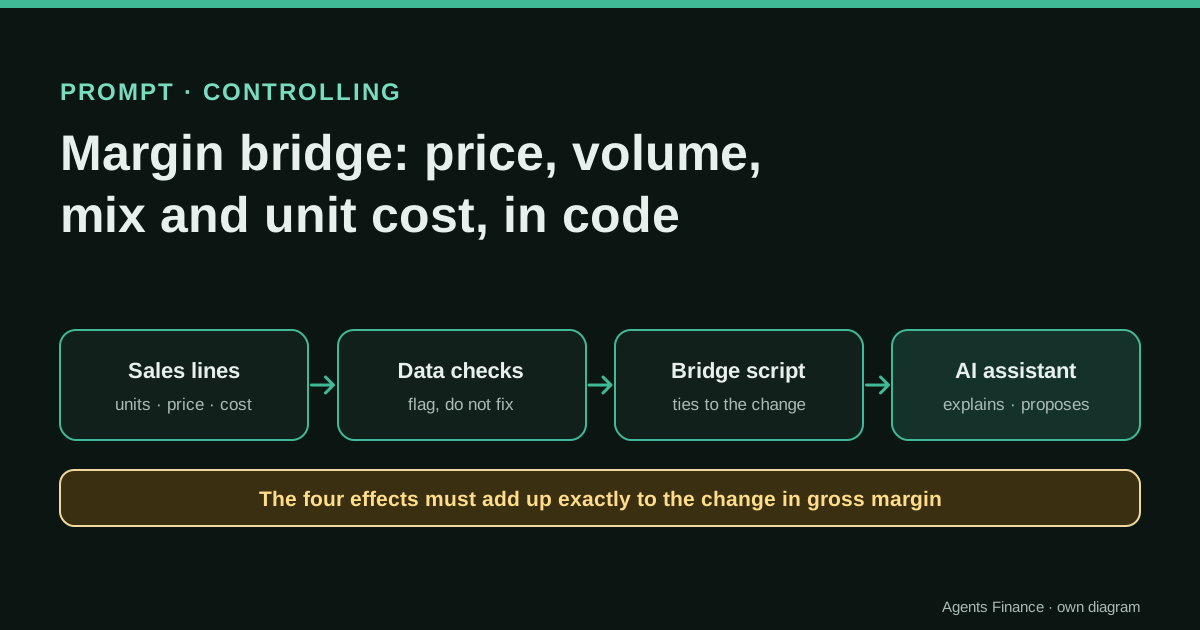
It explains why gross margin changed between two periods by separating four effects: selling more or fewer units (volume), selling a different combination of products (mix), selling at different prices (price) and buying or producing at different unit costs (unit cost). A script validates the invoice lines first, sets aside the ones that look wrong and computes the bridge so that it ties to the change; the AI assistant turns it into an explanation, follows up the suspicious lines and proposes actions.
Expected result and limits
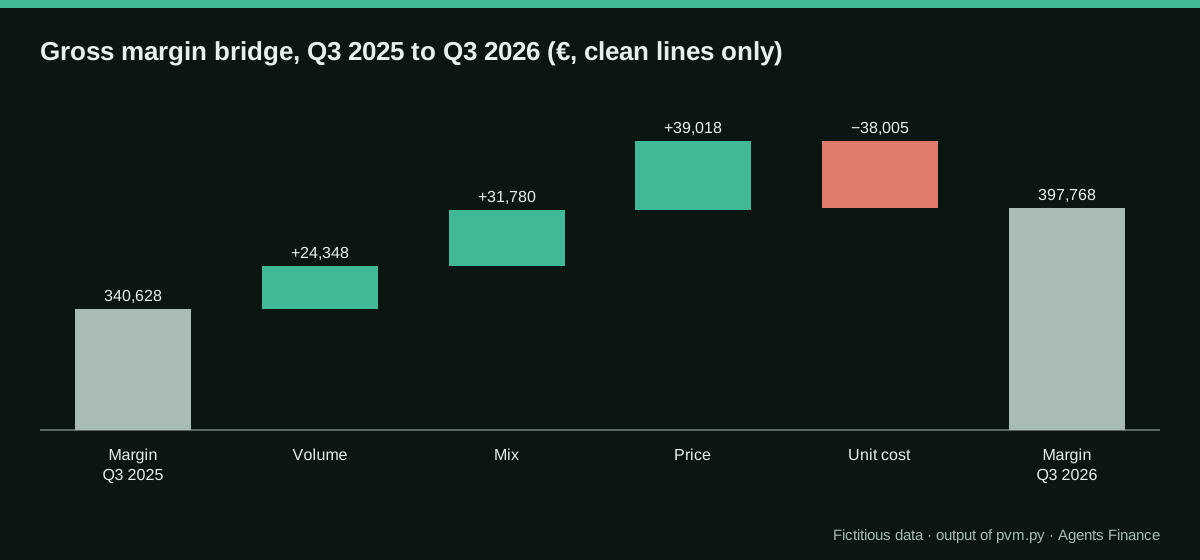
There are no results from real companies: it is a proposal. In the fictitious example published here, gross margin rises from 340,628 to 397,768 while the margin percentage falls from 39.7% to 37.2%; the bridge shows +24,348 from volume, +31,780 from mix, +39,018 from price and −38,005 from unit cost, and three invoice lines are set aside for review.
Mind the evidence. Material written by this directory based on published practices. We have not tested it with real data: try it with sample data first.
What has really been tested
On 19 October 2026 we generated the fictitious invoice lines, ran the bridge script and checked that the four effects add up to the change in gross margin to the cent; the figures in this entry are its output. We have not run the prompt with an AI assistant or on a real company's data, and the example answer is written by us.
The prompt
You are a cost and margin analyst helping me explain the change in gross margin of {{BUSINESS}} between {{PERIOD_0}} and {{PERIOD_1}}.

You receive:
- BRIDGE: the output of a script that has already split the change in gross margin into volume, mix, price and unit-cost effects, with units, net price and unit cost per product for both periods. The four effects add up exactly to the change. Do not recalculate them.
- ISSUES: invoice lines the script excluded (units zero with sales, cost above net sales, discounts above {{DISCOUNT_LIMIT}}), with their totals.
- CONTEXT: {{CONTEXT}}

Tasks:
1. In five sentences at most, explain the bridge in business language: what each effect means here, which products drive it and why margin in euros and margin in % can move in opposite directions.
2. For mix: say which products gained or lost weight and what that does to the average margin per unit.
3. For price and unit cost: compare them product by product and say where the price change did not cover the cost change.
4. For each line in ISSUES: the most likely explanations (data entry, pricing error, special deal, credit note missing) and the document or person that would confirm it ({{OWNERS}}). Do not assume it is an error.
5. Up to five actions (pricing, discount policy, product focus, supplier negotiation, data quality), each with the effect it targets and how we would measure it next quarter. Give no amounts that are not in BRIDGE.
6. Questions for sales, purchasing or operations, each addressed to a team.

Rules: use only figures from BRIDGE and ISSUES; mark anything else as HYPOTHESIS; if something in BRIDGE looks inconsistent, say so.
Without JavaScript you will not see the button: select the text in the block and copy it. License: Original text of this directory. You may use and adapt it freely.
Variables you need to fill in
Replace each placeholder in double curly braces with your data before sending it.
{{BUSINESS}}- Company, business line or region analysed.
{{PERIOD_0}}- Comparison period, for example Q3 2025.
{{PERIOD_1}}- Current period, for example Q3 2026.
{{DISCOUNT_LIMIT}}- Discount above which a line is excluded and reviewed, for example 25%.
{{CONTEXT}}- Price list changes, supplier cost increases, launches, promotions, lost or won customers.
{{OWNERS}}- Who to ask about what: sales for discounts, purchasing for costs, billing for invoices.
How to use it
Export the invoice lines of two comparable periods with units, net sales and cost, run the script and read the data issues before anything else. Reconcile total sales and cost with the P&L, then give the assistant the bridge, the issues and a few lines of context. Try it first on a quarter whose story you already know.
In two sentences
“Margin is up, but the margin percentage is down” is one of the most common sentences in a management meeting, and one of the hardest to explain without a bridge. This entry gives you the formulas, a script that applies them to invoice lines and proves that the effects add up, and a prompt that asks an AI assistant to explain the result instead of calculating it.
The four effects, defined
For each product i and two periods (0 = comparison, 1 = current), take units Q, average net price P (net sales divided by units) and average unit cost C. The unit margin is m = P − C, total units are QT and the mix share of a product in period 0 is s0,i = Q0,i / QT0.
- Volume: (QT1 − QT0) × Σ s0,i × m0,i. More units, at the old mix and the old margins.
- Mix: Σ (Q1,i − QT1 × s0,i) × m0,i. The same total units, but with more weight on some products.
- Price: Σ Q1,i × (P1,i − P0,i). What the change in net price brought on today’s units.
- Unit cost: −Σ Q1,i × (C1,i − C0,i). What the change in unit cost took away on today’s units.
With these definitions the four effects add up exactly to the change in gross margin, with no residual. There are other valid conventions (for example, valuing price at old volumes), but pick one, write it down and keep it every quarter; changing the convention changes the story.
The fictitious data
The sample is a distributor with three products and ten customers, comparing the third quarter of 2025 with the third quarter of 2026: 278 invoice lines with units, list price, discount, net sales and cost. List prices rose 4% and purchase costs about 6%; the sales mix moved towards the most expensive product. We planted three suspicious lines in 2026.
Run python3 pvm.py sales-lines.en.csv. The bridge part of the script is short:
volume = (q1t - q0t) * sum(share0[p] * m0[p] for p in prods)
mix = sum((Q[P1][p] - q1t * share0[p]) * m0[p] for p in prods)
price_eff = sum(Q[P1][p] * (price[P1][p] - price[P0][p]) for p in prods)
cost_eff = -sum(Q[P1][p] * (ucost[P1][p] - ucost[P0][p]) for p in prods)
assert abs((volume + mix + price_eff + cost_eff) - (M1 - M0)) < 0.01, "bridge does not tie"
Before the bridge, the script checks each line and flags, without fixing: units equal to zero with sales, cost above net sales, and discounts of 25% or more. Flagged lines are left out of the bridge and reported with their totals so that you can reconcile them separately.
In a spreadsheet
With one row per product and columns B to G for Q0, Q1, P0, P1, C0 and C1 (rows 2 to 4), the four effects are:
Share 0 (H)      =B2/SUM($B$2:$B$4)
Unit margin 0 (I)=D2-F2
Volume           =(SUM(C2:C4)-SUM(B2:B4))*SUMPRODUCT(H2:H4,I2:I4)
Mix              =SUMPRODUCT(C2:C4-SUM(C2:C4)*H2:H4,I2:I4)
Price            =SUMPRODUCT(C2:C4,E2:E4-D2:D4)
Unit cost        =-SUMPRODUCT(C2:C4,G2:G4-F2:F4)
Add a cell that subtracts the four effects from the change in margin: it must read zero. Python in Excel, which Microsoft documents as a way to run Python inside a workbook, is an alternative if the invoice lines do not fit comfortably in formulas.
What the script returns
| Product | Units Q3 2025 → Q3 2026 | Net price | Unit cost |
|---|---|---|---|
| P-100 | 9,450 → 8,550 | 39.52 → 41.22 | 24.03 → 25.42 |
| P-200 | 4,200 → 6,750 | 83.07 → 85.79 | 54.98 → 58.31 |
| P-300 | 7,349 → 7,200 | 18.36 → 19.21 | 7.98 → 8.49 |
Gross margin goes from 340,628 (39.7%) to 397,768 (37.2%) on the clean lines.
Three lines are excluded, with 18,336 of net sales and 17,934 of cost: one P-200 sale with a 38% discount that is also below cost, one P-300 sale below cost and one line with 1,250 of sales and zero units.
How to use the prompt
Paste the script’s output as BRIDGE and ISSUES, set DISCOUNT_LIMIT to the same threshold as the script, and add CONTEXT. In the example: “list prices +4% from January; two suppliers raised prices 5% to 7%; push on P-200 with a new distributor in the north”.
What a good answer should contain
Written by us as a reference, not model output:
- The % paradox. Margin in euros rose because more units of P-200 were sold, and P-200 earns more euros per unit than the others. But P-200 has the lowest margin percentage (about a third, against about 38% for P-100 and about 56% for P-300), so the average percentage falls. Both statements are true.
- Price against cost. Price added 39,018 and unit cost took away 38,005: the price increase almost exactly covered the cost increase in euros. Product by product, P-200’s cost rose more than its net price (+3.33 against +2.72 per unit), so it is the product where pricing did not keep up.
- Issues. The 38% discount may be a special deal for the new distributor; confirm it with sales before calling it an error. The zero-unit line could be a service charge or a price adjustment invoiced without quantity; ask billing.
- Actions. Review P-200’s price against its new cost; set an approval rule for discounts above 25%; measure next quarter the net price of P-200 and the number of lines excluded.
Variants by ERP: where the invoice lines are
The script needs one row per invoice line (or per product and customer) with units, net sales and cost of sales:
- Odoo: Accounting › Reporting › Invoice Analysis, grouped by product and customer, with quantity, untaxed amount and cost if product costs are kept up to date.
- Microsoft Dynamics 365 Business Central: value entries of type sale, which carry sales amount and cost amount per item entry, opened in Excel.
- NetSuite: a saved search on sales transactions with item, quantity, amount and estimated cost or gross profit.
- SAP S/4HANA: margin analysis line items, which already split revenue and cost of goods sold by product and customer.
- Sage and A3: the sales statistics or invoice-line listing by item and customer, exported to Excel, joined with the item cost if the listing does not include it.
Check two things before trusting the cost: whether it is the actual cost at the date of sale or today’s standard cost, and whether credit notes are included as negative lines.
Human review steps
- Reconcile net sales and cost of the clean lines plus the excluded ones with the P&L for each period.
- Decide what to do with each excluded line (include, correct in the ERP, or leave out) and write it down.
- Check that the bridge ties (the script stops if it does not).
- Read the assistant’s explanation against the table: every number it uses must appear there.
- Agree the actions with sales and purchasing before they appear in a report.
Common mistakes
- Mixing gross and net prices. Use net sales after discounts; list price with a separate discount column hides where the margin went.
- Standard cost in one period and actual in the other. The unit-cost effect then measures a change of method, not of cost.
- New products. A product that did not exist in period 0 has no old margin. Treat it on a separate line (“new products”) instead of forcing it into mix.
- Changing the order of the effects. Valuing price at old volumes or mix at new margins gives different splits; keep one convention.
- Silently dropping bad lines. Excluded lines must be reported and reconciled, otherwise the bridge no longer matches the P&L.
- Letting the assistant compute the bridge. It will produce effects that do not add up, or add up thanks to an invented residual.
Limits
The bridge explains gross margin at product level. It does not allocate overheads, logistics or rebates that are not on the invoice, and it does not tell you which customers are profitable after service costs. Customer and product names are commercial information: anonymise them or use an approved business plan before pasting them into an AI service.
Sources
- Microsoft Support — Get started with Python in Excel (opens in a new tab) (primary)
- NIST/SEMATECH e-Handbook of Statistical Methods — 1.3.5.17 Detection of Outliers (opens in a new tab)
- Claude Docs (Anthropic) — Reduce hallucinations (opens in a new tab)
We wrote this entry in our own words from the sources above and checked that the links worked on October 19, 2026. Is anything incorrect? Tell us.