What they do and how
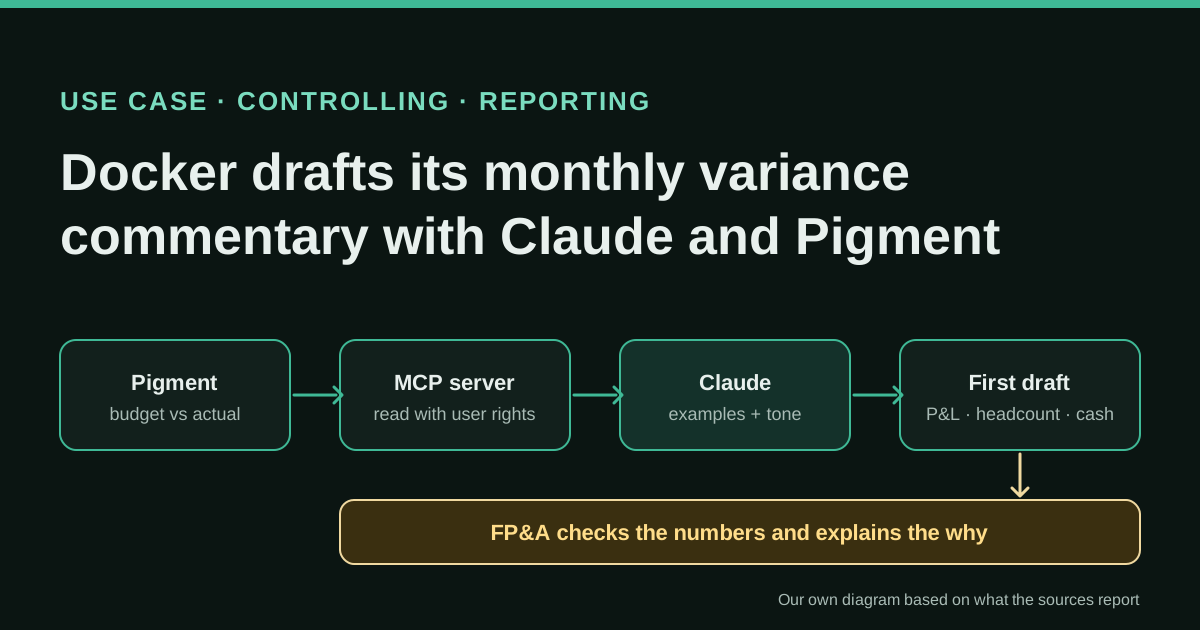
Every month Docker’s strategic FP&A team explains why the P&L, headcount and cash flow landed where they did against budget, and then repackages those explanations for different audiences (executive summary, functional leaders, board material). The budget-versus-actual tables and their context notes live in Pigment. Claude reads them through Pigment’s MCP server and, guided by examples of the team’s own commentaries at each level, writes a first draft in the team’s tone and format. Pigment’s Analyst Agent flags notable movements and trends. Analysts then verify the figures, check that the right drivers are called out and add the business reasons only they know.
Reported result
Stated by Docker in Pigment’s customer story: about 30–50% less time spent on close and review commentary every month, faster insights for executives and less pressure during close. In the podcast companion article the same person gives about 30–40% less commentary time and says close went from a day and a half to closer to a day; she adds that building the workflow forced the team to standardize and reduced rework. Separately, she says the Modeler Agent helped her build a version-dimension plan in under an hour instead of one to two days, and a formula went from 29 to 10 seconds. These are the company’s own estimates, published by the vendor; there is no audit or method.
Stated figures. An identified person or organization states that they have used it. The results are stated by the source; we have not audited them.
What has really been tested
According to the sources, Docker uses the workflow every month in production, after months of iteration with different AI apps, data structures and prompts. The sources do not publish the prompts, the example commentaries, the volume of lines analysed or how the time saving was measured, and the two figures (30–50% and 30–40%) do not match exactly. We have not reproduced the workflow or tested Pigment’s MCP server; the setup steps below come from Pigment’s public documentation, checked on 18 October 2026.
How to replicate it
Start with one commentary that is repetitive and data-rich (for example, monthly P&L budget vs actual). Put clean variance tables and the business context notes in your planning tool, standardize what a good commentary looks like for each audience and collect real examples. Connect your AI assistant to the planning data in read-only mode with the user’s own permissions (in Pigment, its MCP server in default mode), hide sensitive blocks, give the assistant one clearly scoped input per task and your examples, and keep a human who checks every figure and writes the why before anything reaches leadership.
In two sentences
Docker’s strategic FP&A team uses Claude, connected to its planning data in Pigment through an MCP server, to write the first draft of the monthly variance commentary on P&L, headcount and cash flow, while the analysts keep the job of checking the numbers and explaining the business reasons. Docker estimates that this cut the time spent on close commentary by roughly a third to a half; the figure comes from the company itself, published by the software vendor, and has not been audited.
Who does it and why this process
Docker is the company behind the well-known container platform for developers. Its strategic finance team covers planning, forecasting and performance analysis, and, according to Pooja Agrawal, Senior Finance Manager for Strategic FP&A, it also works with teams on cost savings, models investment scenarios for new products and has negotiated contracts on behalf of the business. Before Pigment, Docker used Planful for planning; Pigment’s customer story says the tool lacked flexibility and much of the work stayed in spreadsheets.
The case is published by Pigment, the planning (EPM) vendor Docker moved to, in two pieces: a customer story and the companion article of an episode of its Portraits podcast, recorded with Pooja Agrawal and published on 30 April 2026. Keep that in mind: both are vendor content, and the person interviewed is a customer speaking well of the product.
Why start with variance commentary? Agrawal gives three reasons in the podcast article:
- It is painful and repetitive. Every month the team goes through the P&L, headcount and cash flow, writes why each figure landed where it did, and then repackages the same explanations for different audiences: an executive summary, a view for each functional leader, board material and whatever else is needed.
- It happens at the worst time. It is done during close, with tight deadlines and an already stretched team.
- It was already structured. The variance tables were built in Pigment, the numbers were clean and organized, and the team had already standardized how commentary should be written (tone, format and level of detail for each audience). That made it possible to give the AI exactly what it needed.
That third point is the one most teams skip, and it is the reason the case is worth studying.
Tools and architecture
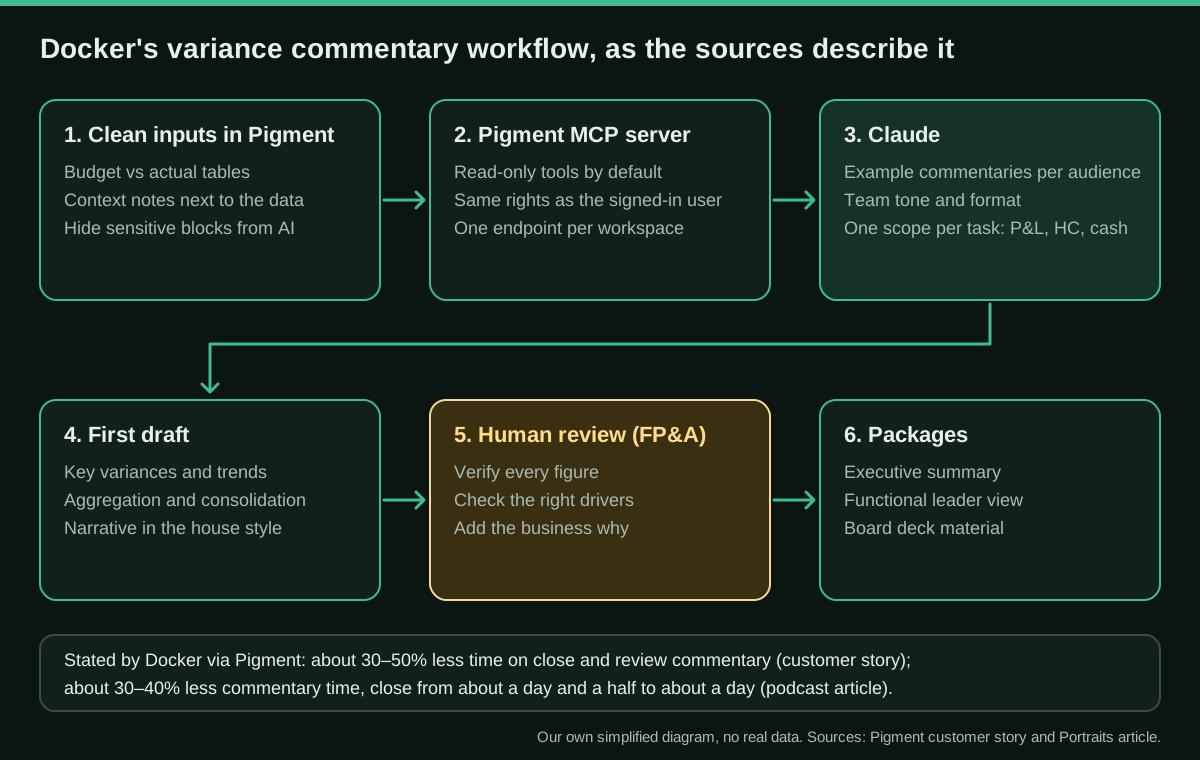
From what the two sources say, the workflow has four pieces:
- Pigment as the source of truth. Budget-versus-actual (BvA) data and its context live in Pigment, “with the right contextual notes in the right places”.
- Pigment’s MCP server. MCP (Model Context Protocol) is the open standard that lets an AI assistant use external tools and data. Pigment’s server lets Claude, ChatGPT and other clients query Pigment data. The public Claude connector lists three tools:
GetApplications,FindAiMetricsandQueryData. - Claude as the writer. Claude ingests the BvA data and context and writes “structured first-draft variance narratives” in the tone and format the team wants. The podcast article says Claude “has been trained on examples” of Agrawal’s commentaries at every level; in practice that reads as being given those examples to imitate, not as training a model. Claude handles the aggregation, the consolidation and the first draft, and she can do everything from its conversational interface.
- Pigment’s Analyst Agent. It summarizes key variances, surfaces notable trends and flags key movements to support the draft.
The human layer closes the loop: the analysts “apply judgment and audience context”, verify accuracy, check that the right drivers are called out and make sure the story being told is the one that matters.
The same story mentions a second, unrelated use: Pigment’s Modeler Agent, which Agrawal calls her “thinking partner” for building models. With it she says she implemented a version-dimension plan in under an hour (normally one to two days of focused work) and optimized a formula from 29 to 10 seconds.
Step by step to replicate it
These steps combine what Docker describes with Pigment’s public documentation. If you use another planning tool (Anaplan, Adaptive, an ERP’s own module or a well-built spreadsheet model), the logic is the same; only the connection changes.
1. Choose one commentary and define “good”
Pick one recurring analysis, for example the monthly P&L versus budget. Write down, for each audience, what a good commentary looks like: length, tone, materiality threshold, how variances are expressed (absolute and percentage) and what must always be explained. Collect three to five real past commentaries per audience as examples. Agrawal’s advice: if you could teach a junior analyst to do it, you can probably teach AI to do it.
2. Clean and scope the input
Agrawal’s main lesson is that the quality of the output is determined by the quality of the input. She scoped each task to its own clearly defined input: P&L commentary runs on P&L data. Feeding cash flow and balance sheet data at the same time introduced ambiguity about which numbers belonged to which analysis, especially when naming conventions overlapped. Practical consequences:
- One table or metric set per commentary, with unambiguous names.
- Store the business context (one-offs, timing differences, reorganizations) as notes next to the data, not in someone’s head. In Pigment, text metrics can hold those comments and the Analyst Agent can use them.
- Do not hand the AI pre-calculated variance metrics if it computes variances itself: Pigment’s documentation warns this can lead to incorrect results in the Analyst Agent.
- Check how each metric aggregates over time; Pigment warns that, otherwise, the agent may sum non-cumulative data such as FTEs or exchange rates.
3. Connect the assistant to the data, read-only
In Pigment, according to its knowledge base:
- MCP is available when Pigment AI is active. Enabling it requires the Security Administrator, Workspace Administrator or Primary Owner role: Settings → Integrations → MCP, toggle it on and copy the unique endpoint URL. Each workspace, and each Test and Deploy environment, needs its own URL and connector.
- In Claude, someone with Owner privileges creates a custom connector (Customize → Connectors → Add custom connector), pastes the URL and leaves the OAuth fields empty, because Pigment handles OAuth. Each user then connects with their own Pigment credentials. Claude Code can use the same connector or a Pigment plugin.
- Every user keeps their existing permissions: they can only reach applications, metrics and data they already see in Pigment. Without the permission to use AI agents, MCP calls to that application fail. Only metrics of type number, integer and boolean can be read via MCP.
- Default mode is read-only. An advanced mode, off by default and enabled by each user, adds write tools (creating metrics, writing formulas, entering data). For commentary you do not need it.
- Before enabling MCP, review access rights and turn off AI data access on blocks with sensitive data (for example, individual salaries). Pigment warns that once MCP is enabled and a connector exists, every workspace member can connect.
- In Claude you can set each tool to Always allow, Needs approval or Blocked.
4. Write the instructions and the examples
Give the assistant the scope, the threshold, the structure and your examples. Below is a prompt written by this directory (not Docker’s, which has not been published), free to use and adapt. It has not been tested with real data.
You are a senior FP&A analyst at {{COMPANY}}. Using only the data returned by the
connected planning tool for {{METRIC_SET}} (for example, P&L by account and
department), compare {{VERSION_A}} with {{VERSION_B}} for {{PERIOD}}.

1. Compute absolute and percentage variances yourself. List only lines where the
   absolute variance exceeds {{THRESHOLD}}, ranked by size.
2. For each line, give the figures and the top contributors one level down
   ({{DRILL_DIMENSION}}). Use the context notes in {{NOTES_METRIC}} to explain
   it; if there is no note, write "Reason to be confirmed by the owner" and do
   not guess.
3. Write the commentary for {{AUDIENCE}} following the style, length and format
   of these examples: {{EXAMPLES}}.
4. End with a table: line | actual | budget | variance | % | source of the
   explanation (note / to be confirmed).
Do not use data outside {{METRIC_SET}}. Do not invent causes. Flag any figure
you could not reconcile with the totals.
If you prefer to stay inside Pigment, its documentation includes ready-made instructions for the Analyst Agent (“Missions”), such as an OPEX variance by account and department with a ±5,000 threshold. Pigment notes that its agents cannot see formulas and that, at the time of writing, Missions do not support time-series analysis or correlations.
5. Review, then repackage
The first draft is the input, not the output. The reviewer checks every figure against the source, confirms that the drivers named are the real ones and writes the business “why”. Only then do you ask the assistant to repackage the approved text for each audience (executive summary, functional view, board). Agrawal puts the line clearly: AI can say how revenue is trending; the team says why.
6. Iterate and measure
Docker needed months: different AI apps and combinations, data structures that were not right, prompts that were not refined and outputs that were not consistent. Measure hours per close before and after, and keep a log of corrections so that repeated fixes go back into the examples or instructions.
A concrete example of the output
Pigment’s documentation shows the kind of line a variance instruction should produce, using illustrative figures of its own: “GL 60000 - Salaries: +€15.2k vs Budget (+18%) - Higher training expenses in Marketing (+€8.7k)”. The value of Docker’s approach is that the explanation part of such a line comes from a context note or from a human, not from the model’s imagination. A useful rule is that every explanation in the draft should point to its origin (a note, a document or “to be confirmed”).
Results stated and how to read them
- Customer story (Pigment): Docker “estimates” about 30–50% less time on close and review commentary each month; faster insights for executives; less pressure at close, more time for forecasting; more focused discussions with leadership.
- Podcast article (Pigment): about 30–40% less dedicated commentary time, and close “moving from a day and a half to closer to a day” (the text does not say whether this refers to the whole close or to the commentary part). Unexpected benefit: more standardization, less rework and fewer rounds of back-and-forth.
- Modeler Agent: a version-dimension plan in under an hour instead of one to two days; a formula from 29 to 10 seconds.
These are self-reported estimates in marketing content. There is no baseline, no measurement method and no figure on volume or error rates. The direction is credible and consistent across both pieces; the exact percentage is not.
Limitations and risks
- Vendor content. Both main sources are published by Pigment. We found no independent account from Docker itself.
- Commentary is judgment. A fluent paragraph can name the wrong driver. Agrawal keeps the interpretation and the decision with people.
- Data exposure. An MCP connection opens planning data to an external AI service. Review access rights, hide sensitive blocks and check your contract and data-processing terms with the AI provider.
- Write access. Advanced mode can create metrics, formulas and data. Keep it off for this use, or require approval for each write tool.
- Mixed scopes produce errors. Docker’s own experience: mixing P&L, cash flow and balance sheet data with overlapping names confused the output.
- Aggregation traps. Non-cumulative metrics (FTEs, exchange rates) and pre-calculated variances can produce wrong numbers if they are not configured correctly.
- Text from the business is input too. Context notes written by budget owners are useful, but treat them as data to verify, not as instructions.
Common mistakes
- Starting with a messy model and expecting the AI to “figure it out”: Agrawal calls this the misconception that causes distrust.
- Asking for all the commentary at once (P&L, cash and balance sheet) instead of one scoped task each.
- Giving no examples, and then blaming the AI for tone and format.
- Letting the model invent causes when there is no note, instead of marking them “to be confirmed”.
- Sending the draft to leadership without a figure-by-figure check.
- Enabling write tools “just in case”.
- Giving up after the first weeks: Docker’s workflow took months to become reliable.
Conclusions
Docker’s case is not about a spectacular agent; it is about a finance team that did the groundwork (clean, scoped variance tables, context notes beside the data and a written standard for good commentary) and then let an assistant do the assembly and the first draft. The reported saving, a third to a half of the commentary time, is self-reported and published by the vendor, but the method is easy to copy with any planning tool that exposes its data to an assistant in read-only mode. What stays human is what matters most: checking the numbers and explaining why they moved.
Sources
- Pigment — How Docker puts AI agents to work in FP&A with Pigment (customer story) (opens in a new tab) (primary)
- Pigment Portraits — Designing the financial engine with Pooja Agrawal (Docker) (podcast companion article) (opens in a new tab)
- YouTube — Pooja Agrawal (Docker): Designing a financial engine from scratch (episode, 30 April 2026) (opens in a new tab)
- Pigment Knowledge Base — MCP Server (opens in a new tab)
- Pigment Knowledge Base — Supported tools (default and advanced mode) (opens in a new tab)
- Pigment Knowledge Base — Connect common MCP clients (Claude, Claude Code) (opens in a new tab)
- Pigment Knowledge Base — Mission instructions for the Analyst Agent (opens in a new tab)
- Pigment Knowledge Base — Configure and run the Analyst Agent (troubleshooting) (opens in a new tab)
- Claude — Pigment connector (opens in a new tab)
We wrote this entry in our own words from the sources above and checked that the links worked on October 18, 2026. Is anything incorrect? Tell us.